EEG Neuro Earbuds
Turning raw brainwaves into a dashboard people understand.
ROLE
Product Designer
TOOLS
PROJECT TYPE
Figma, Figma Make, Figma Agents, Claude Code
Case Study
KEY SCREENS
Home Dashboard
AI Insights


Trends / Analysis
Sessions / Reports
Device / Settings
DESIGN PROCESS
I wanted to use a bento-box layout, so the data and insights each get their own space and stay easy to scan.
I prompted Claude Opus 5 what I was looking for, Focus, Sleep, and Stress metrics, as well as AI insights. After playing around with a bit of prompting I had a decent idea of what the dashboard should look like. Below is what Claude gave me.
I wanted to keep the style as easy to read and minimal as possible. I opted for a transparent glass look with 3 colors to indicate the type of data it represented. Below is the first Hi-Fi screen I designed of the home dash.
I decided to add a few things to the designs, I wanted an indicator on the dashboard that showed if your earbuds were connected and what battery was. I also wanted to include an AI search bar for each screen, that way the user can easily ask about any of the data or insights they see.

Good morning, Sam

SIGNAL MAP
THURSDAY, AUG 6
NEURAL INTERFACE
CURRENT MENTAL STATE
AI INSIGHTS
Step away from your current task and reset.
BASELINE
2:44 PM
Stressed
High stress level detected

FOCUS
/ 100
64
4 vs 7-day avg
Focus held for 1h 40m this morning, your longest block of the week.
SLEEP
/ 100
71
11 vs 7-day avg
6h 42m in bed. Deep sleep ran short and you woke up twice after 7 AM.
STRESS
/ 100
44
8 vs 7-day avg
Rose sharply yesterday and today between 1 and 4 PM.
Your Afternoon dip is becoming a pattern.
Fell 31% for 40 min, a very similar window that tends to drop on 5 of the last 7 days.
Block a break at 1:45 PM
Stress is starting to affect you significantly
Higher levels of stress in the afternoon is lowering your focus and sleep scores across the board.
See why it matters
Deep sleep was cut short by 2 wake events
Both landed after 1 AM, inside your first deep cycle.
Shift wind-down earlier
Short nights costed you 18 focus points
Every night that you got under 7 hours of sleep was followed by a measurably lower focus score.
See the correlation
Today
Week
Month
NAOX
Connected
EARBUDS
Synced 6 min ago
82%

Ask NAOX AI anything
THE PROBLEM
GOALS
SAMPLE OF THE CURRENT NAOX DASHBOARD
OVERVIEW
RESEARCH
USER JOURNEY
TAKEAWAY
REFLECTION
WHY THIS MATTERS
FINDINGS
SAID BY
Naox makes in-ear EEG hardware. Naox Link, its clinical device, recently was able to hold FDA clearance. Naox Wave, the consumer platform, is built for everyday brain monitoring, wellness, not diagnosis. The hardware existed but the product layer didn't.
I designed the dashboard for Naox Wave: home screen, AI insights, and reporting, that turns raw neural signal and data into something intuitive, usable, and connected to the person wearing it.
My role: end-to-end design, from IA to high-fidelity UI to the AI copilot model.
Before designing I wanted to understand how users interpret wearable data, and what they like and dislike about current wearable interfaces on the market. I interviewed 6 people who use EEG or biometric wearables (3 use Apple Watch, 2 use Oura, and 1 uses Whoop) about how they read and act on their own data.
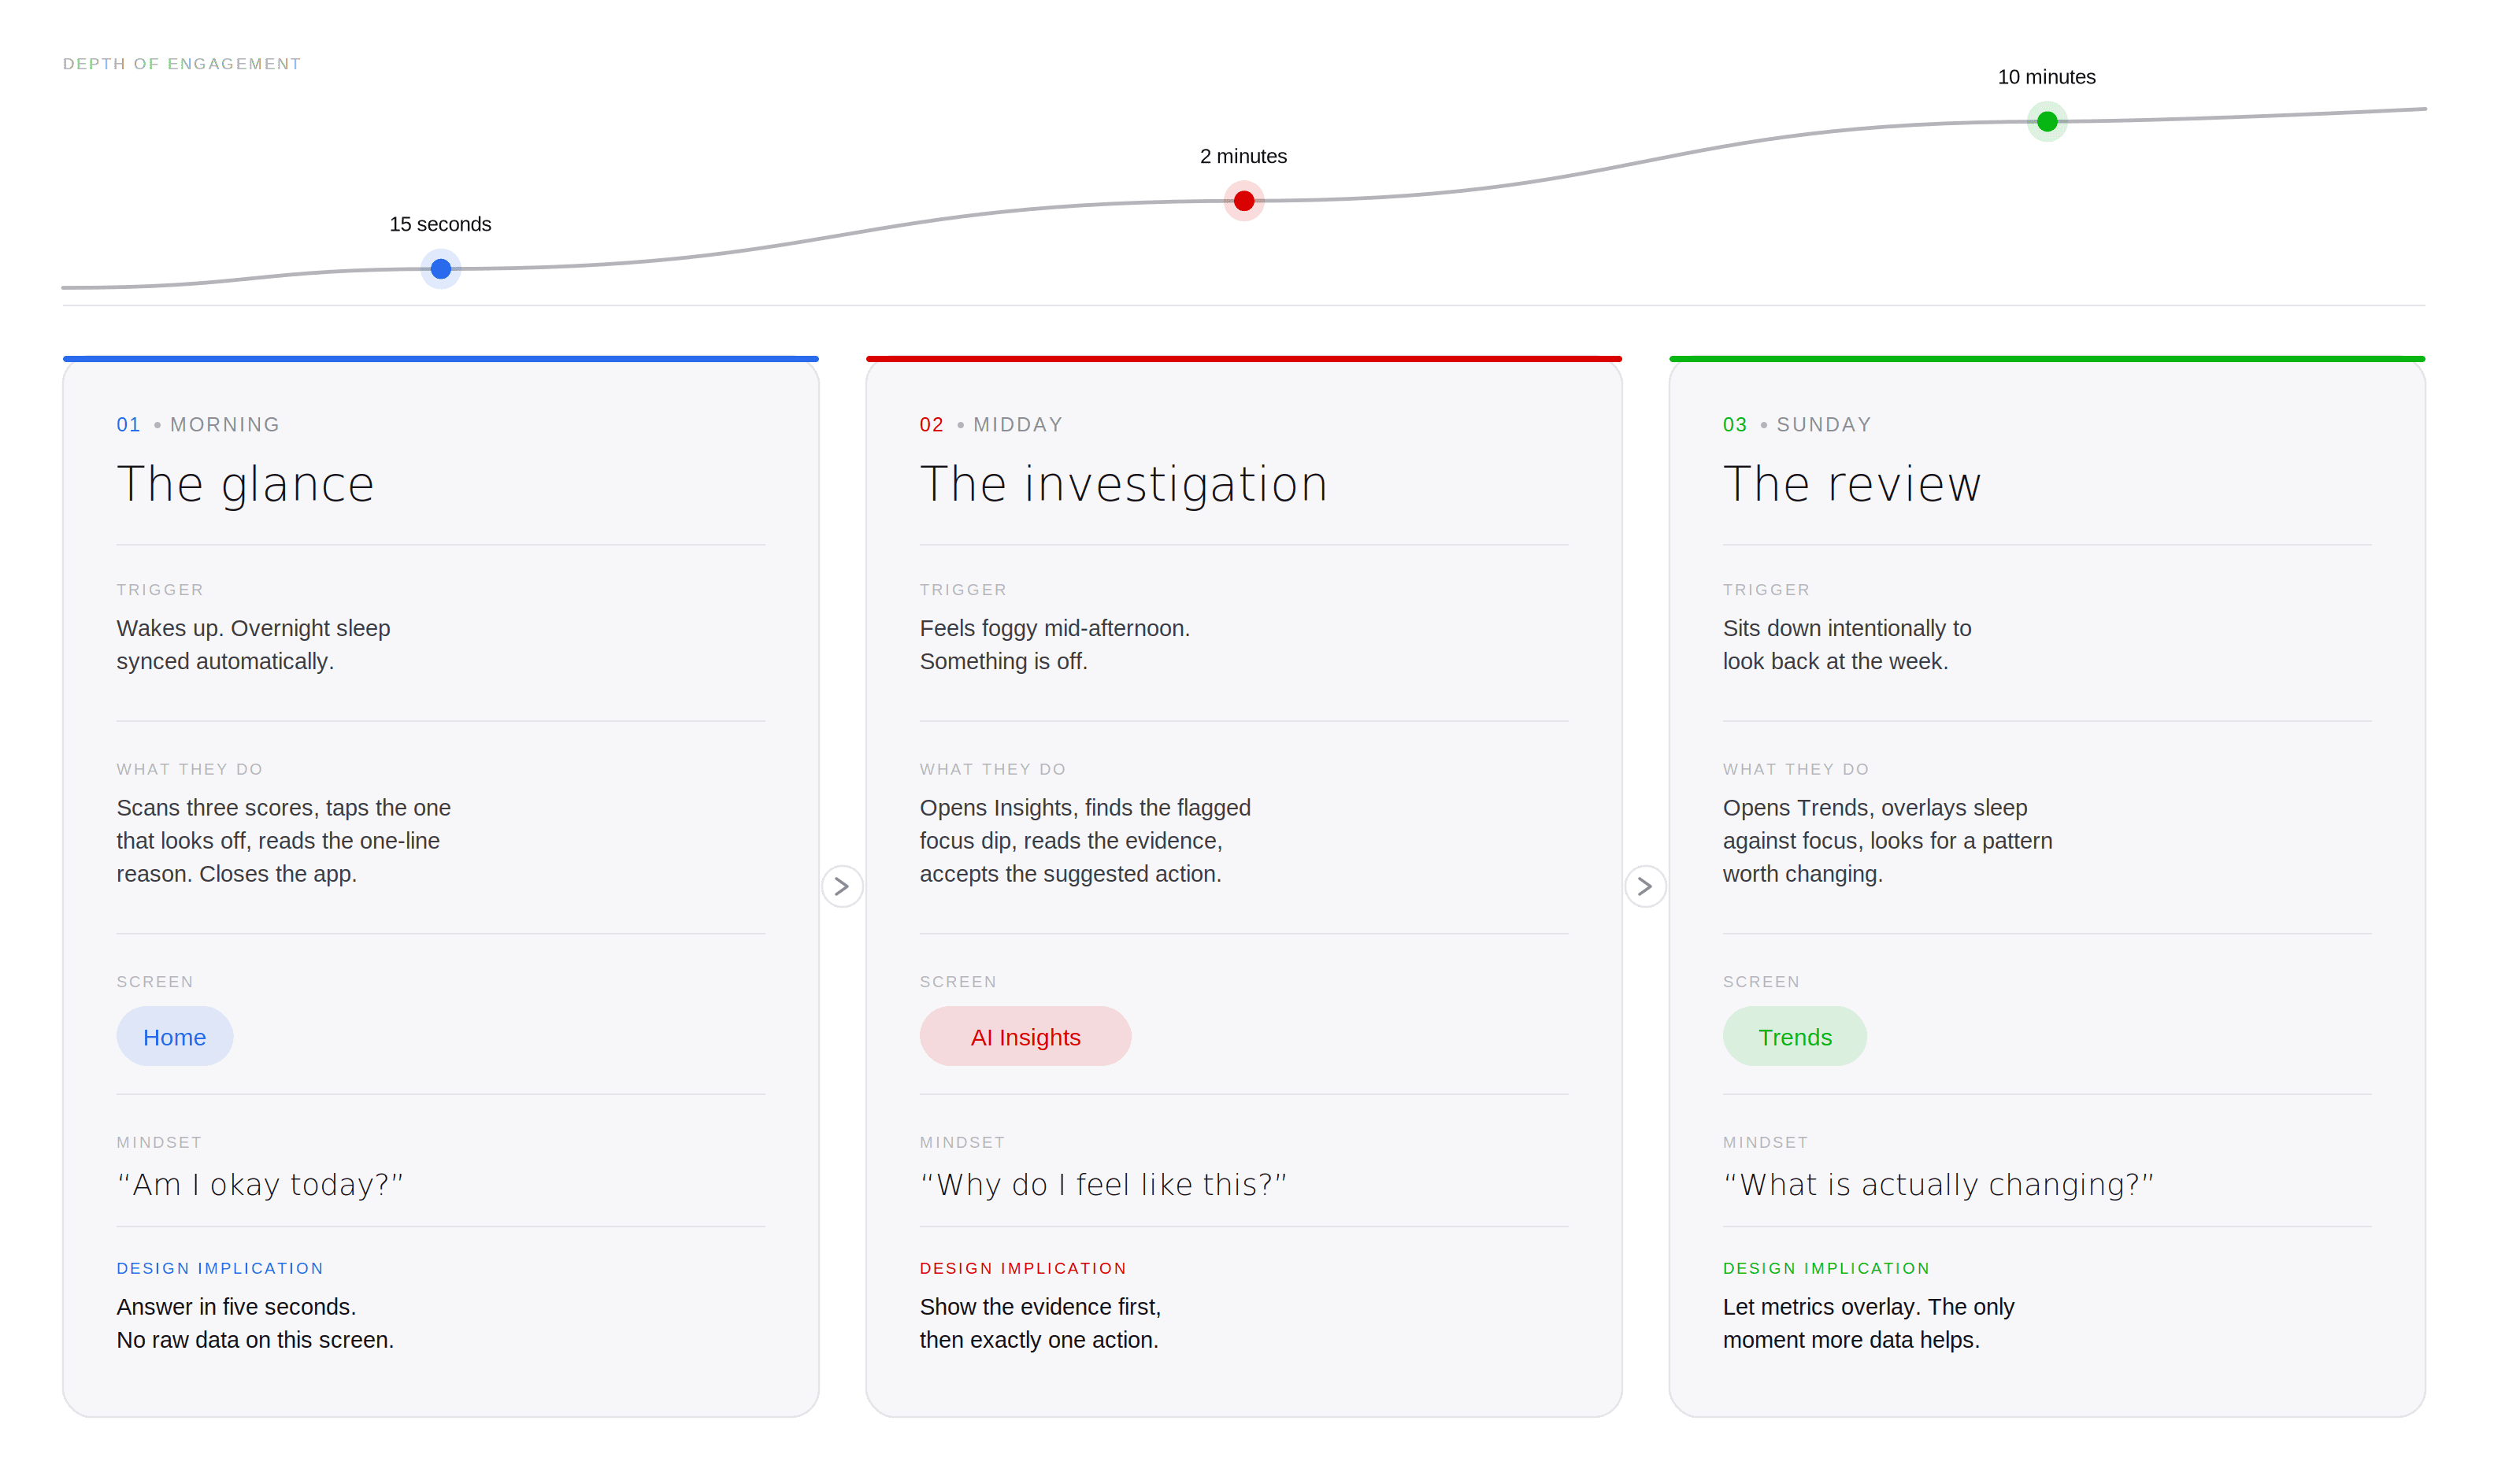
People don't check this app the same way twice. A morning glance, a midday investigation, a Sunday review, each one calling for a different depth of information. Mapping these moments is what shaped the screens above.
The hardest part wasn't the interface, it was deciding what belonged on it. Naox had a constant stream of technical data, and the instinct was to show it off, to prove the sensors and the AI were smart.
Instead, I kept pulling back which lead to fewer numbers, clearer reasoning, an AI that explained rather than dumped.
That restraint became the principle I'd carry into any product sitting on a complex data source, the job isn't to prove what the system knows, it's to make one thing clear enough to act on.
People don't distrust wearables because the data's wrong. They distrust them because nothing explains itself. A number with no reason behind it reads as a guess, even when it's accurate, and that gap is what pushes people to stop checking the app altogether.
Naox is asking people to trust a device reading their brain. That's a higher bar than a step count. If the dashboard can't explain itself, people won't just distrust the score, they'll distrust the hardware. Every design decision after this had to answer one question. Does this build trust, or does it just display data?
Does not understand what the score is exactly saying
3/6 users
Prefers a number, not an entire breakdown
5/6 users
Questions accuracy of unexplained scores
4/6 users
Wants suggested action, not just data
5/6 users
Early builds dumped raw EEG data straight onto the screen. It looked more like a lab tool, not something connected to you.
The issue wasn't the data, it was the disconnect from data/product to the user.
People don't want to read their brainwaves. They want their dashboard to already know them.
Turn EEG datainto three metrics people already get: Focus, Stress, Sleep
One insight, one action, not ten charts
Works at a glance and on a deep dive
Feels like an extension of you, not an instrument watching you
NAOX


NEXT PROJECT
EEG Neuro Earbuds
Turning raw brainwaves into a dashboard people understand.
ROLE
Product Designer
TOOLS
PROJECT TYPE
Figma, Figma Make, Figma Agents, Claude Code
Case Study
KEY SCREENS
Home Dashboard
AI Insights
Trends / Analysis
Sessions / Reports
Device / Settings
DESIGN PROCESS
I wanted to use a bento-box layout, so the data and insights each get their own space and stay easy to scan.
I prompted Claude Opus 5 what I was looking for, Focus, Sleep, and Stress metrics, as well as AI insights. After playing around with a bit of prompting I had a decent idea of what the dashboard should look like. Below is what Claude gave me.
I wanted to keep the style as easy to read and minimal as possible. I opted for a transparent glass look with 3 colors to indicate the type of data it represented. Below is the first Hi-Fi screen I designed of the home dash.
I decided to add a few things to the designs, I wanted an indicator on the dashboard that showed if your earbuds were connected and what battery was. I also wanted to include an AI search bar for each screen, that way the user can easily ask about any of the data or insights they see.
Good morning, Sam
SIGNAL MAP
THURSDAY, AUG 6
NEURAL INTERFACE
CURRENT MENTAL STATE
AI INSIGHTS
Step away from your current task and reset.
BASELINE
2:44 PM
Stressed
High stress level detected
FOCUS
/ 100
64
4 vs 7-day avg
Focus held for 1h 40m this morning, your longest block of the week.
SLEEP
/ 100
71
11 vs 7-day avg
6h 42m in bed. Deep sleep ran short and you woke up twice after 7 AM.
STRESS
/ 100
44
8 vs 7-day avg
Rose sharply yesterday and today between 1 and 4 PM.
Your Afternoon dip is becoming a pattern.
Fell 31% for 40 min, a very similar window that tends to drop on 5 of the last 7 days.
Block a break at 1:45 PM
Stress is starting to affect you significantly
Higher levels of stress in the afternoon is lowering your focus and sleep scores across the board.
See why it matters
Deep sleep was cut short by 2 wake events
Both landed after 1 AM, inside your first deep cycle.
Shift wind-down earlier
Short nights costed you 18 focus points
Every night that you got under 7 hours of sleep was followed by a measurably lower focus score.
See the correlation
Today
Week
Month
NAOX
Connected
EARBUDS
Synced 6 min ago
82%
Ask NAOX AI anything
THE PROBLEM
GOALS
SAMPLE OF THE CURRENT NAOX DASHBOARD
OVERVIEW
RESEARCH
USER JOURNEY
TAKEAWAY
REFLECTION
WHY THIS MATTERS
FINDINGS
SAID BY
Naox makes in-ear EEG hardware. Naox Link, its clinical device, recently was able to hold FDA clearance. Naox Wave, the consumer platform, is built for everyday brain monitoring, wellness, not diagnosis. The hardware existed but the product layer didn't.
I designed the dashboard for Naox Wave: home screen, AI insights, and reporting, that turns raw neural signal and data into something intuitive, usable, and connected to the person wearing it.
My role: end-to-end design, from IA to high-fidelity UI to the AI copilot model.
Before designing I wanted to understand how users interpret wearable data, and what they like and dislike about current wearable interfaces on the market. I interviewed 6 people who use EEG or biometric wearables (3 use Apple Watch, 2 use Oura, and 1 uses Whoop) about how they read and act on their own data.
People don't check this app the same way twice. A morning glance, a midday investigation, a Sunday review, each one calling for a different depth of information. Mapping these moments is what shaped the screens above.
The hardest part wasn't the interface, it was deciding what belonged on it. Naox had a constant stream of technical data, and the instinct was to show it off, to prove the sensors and the AI were smart.
Instead, I kept pulling back which lead to fewer numbers, clearer reasoning, an AI that explained rather than dumped.
That restraint became the principle I'd carry into any product sitting on a complex data source, the job isn't to prove what the system knows, it's to make one thing clear enough to act on.
People don't distrust wearables because the data's wrong. They distrust them because nothing explains itself. A number with no reason behind it reads as a guess, even when it's accurate, and that gap is what pushes people to stop checking the app altogether.
Naox is asking people to trust a device reading their brain. That's a higher bar than a step count. If the dashboard can't explain itself, people won't just distrust the score, they'll distrust the hardware. Every design decision after this had to answer one question. Does this build trust, or does it just display data?
Does not understand what the score is exactly saying
3/6 users
Prefers a number, not an entire breakdown
5/6 users
Questions accuracy of unexplained scores
4/6 users
Wants suggested action, not just data
5/6 users
Early builds dumped raw EEG data straight onto the screen. It looked more like a lab tool, not something connected to you.
The issue wasn't the data, it was the disconnect from data/product to the user.
People don't want to read their brainwaves. They want their dashboard to already know them.
Turn EEG datainto three metrics people already get: Focus, Stress, Sleep
One insight, one action, not ten charts
Works at a glance and on a deep dive
Feels like an extension of you, not an instrument watching you
NAOX
NEXT PROJECT
EEG Neuro Earbuds
Turning raw brainwaves into a dashboard people understand.
ROLE
Product Designer
TOOLS
PROJECT TYPE
Figma, Figma Make, Figma Agents, Claude Code
Case Study
KEY SCREENS
Home Dashboard
AI Insights
Trends / Analysis
Sessions / Reports
Device / Settings
DESIGN PROCESS
I wanted to use a bento-box layout, so the data and insights each get their own space and stay easy to scan.
I prompted Claude Opus 5 what I was looking for, Focus, Sleep, and Stress metrics, as well as AI insights. After playing around with a bit of prompting I had a decent idea of what the dashboard should look like. Below is what Claude gave me.
I wanted to keep the style as easy to read and minimal as possible. I opted for a transparent glass look with 3 colors to indicate the type of data it represented. Below is the first Hi-Fi screen I designed of the home dash.
I decided to add a few things to the designs, I wanted an indicator on the dashboard that showed if your earbuds were connected and what battery was. I also wanted to include an AI search bar for each screen, that way the user can easily ask about any of the data or insights they see.
Good morning, Sam
SIGNAL MAP
THURSDAY, AUG 6
NEURAL INTERFACE
CURRENT MENTAL STATE
AI INSIGHTS
Step away from your current task and reset.
BASELINE
2:44 PM
Stressed
High stress level detected
FOCUS
/ 100
64
4 vs 7-day avg
Focus held for 1h 40m this morning, your longest block of the week.
SLEEP
/ 100
71
11 vs 7-day avg
6h 42m in bed. Deep sleep ran short and you woke up twice after 7 AM.
STRESS
/ 100
44
8 vs 7-day avg
Rose sharply yesterday and today between 1 and 4 PM.
Your Afternoon dip is becoming a pattern.
Fell 31% for 40 min, a very similar window that tends to drop on 5 of the last 7 days.
Block a break at 1:45 PM
Stress is starting to affect you significantly
Higher levels of stress in the afternoon is lowering your focus and sleep scores across the board.
See why it matters
Deep sleep was cut short by 2 wake events
Both landed after 1 AM, inside your first deep cycle.
Shift wind-down earlier
Short nights costed you 18 focus points
Every night that you got under 7 hours of sleep was followed by a measurably lower focus score.
See the correlation
Today
Week
Month
NAOX
Connected
EARBUDS
Synced 6 min ago
82%
Ask NAOX AI anything
THE PROBLEM
GOALS
SAMPLE OF THE CURRENT NAOX DASHBOARD
OVERVIEW
RESEARCH
USER JOURNEY
TAKEAWAY
REFLECTION
WHY THIS MATTERS
FINDINGS
SAID BY
Naox makes in-ear EEG hardware. Naox Link, its clinical device, recently was able to hold FDA clearance. Naox Wave, the consumer platform, is built for everyday brain monitoring, wellness, not diagnosis. The hardware existed but the product layer didn't.
I designed the dashboard for Naox Wave: home screen, AI insights, and reporting, that turns raw neural signal and data into something intuitive, usable, and connected to the person wearing it.
My role: end-to-end design, from IA to high-fidelity UI to the AI copilot model.
Before designing I wanted to understand how users interpret wearable data, and what they like and dislike about current wearable interfaces on the market. I interviewed 6 people who use EEG or biometric wearables (3 use Apple Watch, 2 use Oura, and 1 uses Whoop) about how they read and act on their own data.
People don't check this app the same way twice. A morning glance, a midday investigation, a Sunday review, each one calling for a different depth of information. Mapping these moments is what shaped the screens above.
The hardest part wasn't the interface, it was deciding what belonged on it. Naox had a constant stream of technical data, and the instinct was to show it off, to prove the sensors and the AI were smart.
Instead, I kept pulling back which lead to fewer numbers, clearer reasoning, an AI that explained rather than dumped.
That restraint became the principle I'd carry into any product sitting on a complex data source, the job isn't to prove what the system knows, it's to make one thing clear enough to act on.
People don't distrust wearables because the data's wrong. They distrust them because nothing explains itself. A number with no reason behind it reads as a guess, even when it's accurate, and that gap is what pushes people to stop checking the app altogether.
Naox is asking people to trust a device reading their brain. That's a higher bar than a step count. If the dashboard can't explain itself, people won't just distrust the score, they'll distrust the hardware. Every design decision after this had to answer one question. Does this build trust, or does it just display data?
Does not understand what the score is exactly saying
3/6 users
Prefers a number, not an entire breakdown
5/6 users
Questions accuracy of unexplained scores
4/6 users
Wants suggested action, not just data
5/6 users
Early builds dumped raw EEG data straight onto the screen. It looked more like a lab tool, not something connected to you.
The issue wasn't the data, it was the disconnect from data/product to the user.
People don't want to read their brainwaves. They want their dashboard to already know them.
Turn EEG datainto three metrics people already get: Focus, Stress, Sleep
One insight, one action, not ten charts
Works at a glance and on a deep dive
Feels like an extension of you, not an instrument watching you
NAOX
NEXT PROJECT